GPU Price-Performance Tracker
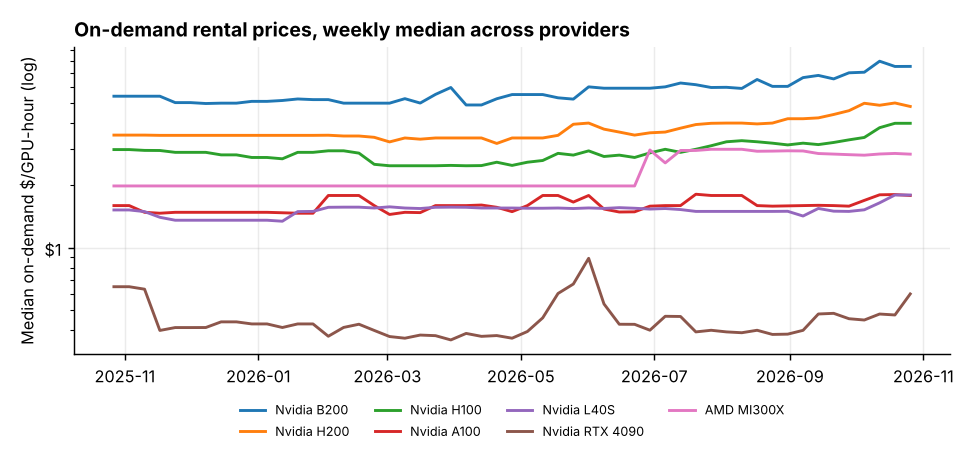
Renting a data-center GPU got 30–40% more expensive over the past year, even as price-performance at purchase keeps doubling every few years. The H100's median on-demand price rose from $2.97 to $3.90 per GPU-hour between late October 2025 and late October 2026. Buying one pays for itself in about a year of continuous use.
Data through the week of Oct 26, 2026. Built with Python, DuckDB SQL and statsmodels.
Key findings
- Data-center rentals rose; the market did not get cheaper. Comparing each GPU's first four weeks with its last four, the median on-demand price rose 31% for the H100, 41% for the H200, 39% for the B200, 43% for the AMD MI300X and 17% for the A100. Across all 88 GPUs with at least 26 weeks of prices, the median change was +15%, and only 1 in 4 got cheaper.
- Consumer cards split. Flagships got cheaper to rent (RTX 4090 −26%, RTX 5090 −5%) while mid-range cards jumped (RTX 5070 +115%, RTX 4080 +75%).
- Rental prices outran the computers CPI. A chain-linked index over the 70 GPUs priced in every week rose 18% from Nov 2025 to Oct 2026 (data-center GPUs alone: +13%). The BLS consumer price index for computers rose 13% from Nov 2025 to Sep 2026 and was up 10% year over year in Sep 2026. That reverses a long trend: the same index is 97% lower than in Dec 1997.
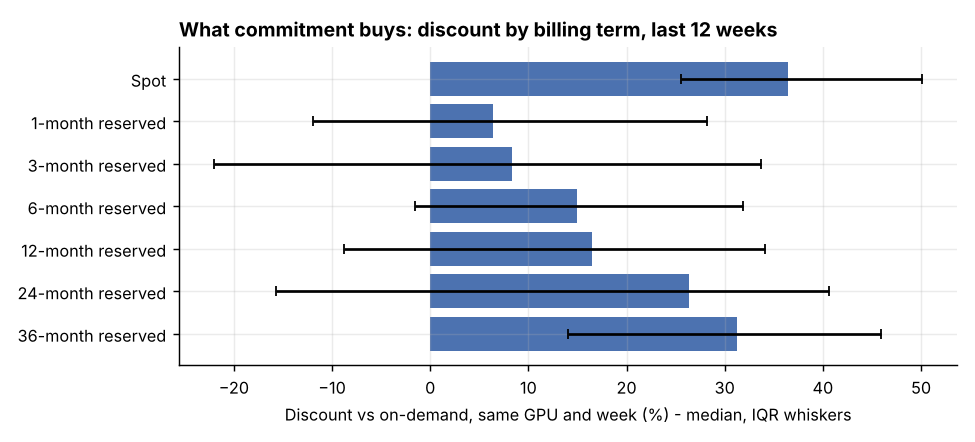
- Spot pricing beats every commitment. Over the last 12 weeks, spot capacity was a median 36% below on-demand for the same GPU and week. A 36-month reservation saved 31%, but a 1-month reservation saved only 6%, and for most terms a quarter of reserved prices were above the on-demand median. Shopping across providers matters more than committing. Today's H100 listings range from $1.75 to $12.29 per hour across 40 providers.
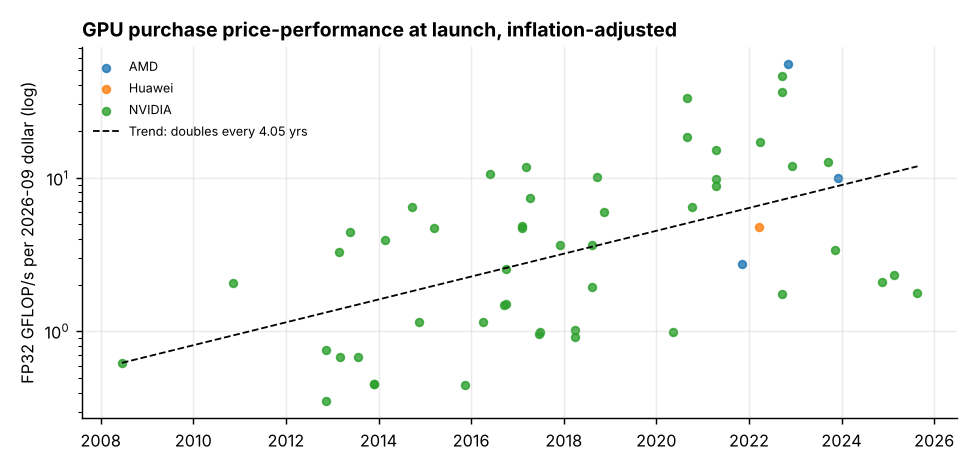
- Purchase price-performance doubles about every 4 years (95% CI 2.8–7.1 years) across 54 GPUs from 2008 to 2025, in FP32 FLOP/s per inflation-adjusted launch dollar. Consumer GeForce cards improve faster, doubling every 2.7 years (R² 0.89), than workstation and data-center parts (3.7 years).
- Buy versus rent. At today's rental rates and $0.15/kWh power, an RTX 4090 pays for itself after about 3,900 hours: 5 months of 24/7 use, or about 22 months at 8 hours a weekday. An H100 needs about 8,900 hours (12 months of 24/7 use) before counting the server it sits in.
- Short-term forecasts barely beat "no change". On a 12-week holdout, damped-trend exponential smoothing scored 5.8% MAPE on the H100 against 5.9% for a naive last-value forecast, and did worse on the A100. Weekly prices behave close to a random walk, so budgets should use ranges. The 12-week H100 forecast is $4.74 per hour (80% interval $4.28–$5.21).
 |
 |
Dashboard
Open the interactive dashboard. Every table behind it is in reports/tables/, ready to load into Power BI or Tableau.
Questions answered
| # | Question | Output |
|---|---|---|
| Q1 | How fast are rental prices changing, by GPU? | q1_rental_price_change.csv, q1_key_gpu_weekly.csv |
| Q2 | Is the spread across providers narrowing? | q2_provider_spread_weekly.csv |
| Q3 | What do reserved and spot terms save vs on-demand? | q3_discount_vs_on_demand.csv |
| Q4 | How quickly does price-performance improve? | q4_purchase_price_performance.csv, q4_current_rental_value.csv |
| Q5 | When does buying beat renting? | q5_buy_vs_rent_breakeven.csv |
| Q6 | How do GPU rentals compare with the consumer computers CPI? | q6_rental_index_vs_cpi.csv, q6_cpi_computers_monthly.csv |
| — | Where are prices heading in the next 12 weeks? | forecast_weekly.csv, forecast_backtest.csv |
Data
| Source | Contents | Rows | License |
|---|---|---|---|
| GetDeploying GPU rental price history | Weekly min, median and max $/GPU-hour by model and billing term; provider and listing counts | 16,488 | CC BY 4.0 |
| GetDeploying GPU models | VRAM, FP16/FP32 throughput, TDP, release date, market class | 113 | CC BY 4.0 |
| Epoch AI Machine Learning Hardware | Launch prices and performance for 183 accelerators | 183 | CC BY 4.0 |
| BLS CPI: computers, peripherals and smart home assistants | Monthly, Dec 1997 onward | 345 | Public domain |
| BLS CPI-U all items | Deflator to Sep 2026 dollars | 956 | Public domain |
| BLS PPI: computer and electronic products | Producer-side index | 274 | Public domain |
Rental data: GetDeploying (2026), GPU rental price history and GPU models, CC BY 4.0. Hardware data: Epoch AI, Data on Machine Learning Hardware, CC BY 4.0.
Method
- Model.
sql/01_model.sqlbuilds a DuckDB star schema:fact_rental_price_weekly(GPU × week × billing term),dim_gpu(specs plus Epoch launch price),fact_price_index_monthlyanddim_deflator. Per-minute on-demand and the oddRESERVATION_12_MONTHlabel stay separate billing types, because folding them in created duplicate GPU-week rows; a data-quality check indq_logconfirms zero duplicate keys. - Joining two sources. GetDeploying slugs and Epoch hardware names don't match, so
data/reference/gpu_purchase_map.csvmaps 33 GPUs by hand and notes every ambiguous match (for example, H100 rentals mix SXM and PCIe, but only the SXM5 has a launch price). - Rental index. An equal-weight, chain-linked index of week-over-week log changes over a balanced panel (GPUs priced in every week since Oct 27, 2025), so changes in which GPUs are listed don't move it.
- Inflation. Launch prices are deflated to Sep 2026 dollars with CPI-U.
- Doubling time. OLS of log2(GFLOP/s per real dollar) on release date; doubling time = 1 / slope, CI from the slope's standard error.
- Discounts. Each reserved or spot median is compared with the on-demand median for the same GPU in the same week.
Limitations
- Prices are listing prices, not transaction prices, and a GPU's weekly median depends on which providers list it that week.
- Most models have prices only from Oct 27, 2025; older GPUs with long series dominate the trend table less than they would in an unbalanced comparison.
- Launch prices are list prices at release, not today's street price, and data-center parts exclude the host server, networking and hosting.
- BLS published no October 2025 value for the computers CPI, so that month is blank.
Keep the history growing
GetDeploying publishes a trailing window only. src/collect_daily.py saves a dated snapshot each day and merges it into data/processed/rental_snapshots.parquet (re-runs on the same day replace, not duplicate). On Windows, register it as a scheduled task:
.\scripts\Register-CollectorTask.ps1 -WhatIf   # preview
.\scripts\Register-CollectorTask.ps1           # create the daily task
Reproduce
pip install -r requirements.txt
python src/extract.py        # download raw data  (--what-if to preview)
python src/transform.py      # build data/gpu.duckdb
python src/analysis.py       # tables, figures, findings.json
python notebooks/_build_notebook.py   # optional: re-execute the walkthrough notebook
Repository layout
src/            extract, transform, analysis, daily collector
sql/            DuckDB model
data/reference/ hand-built GPU name mapping
notebooks/      executed walkthrough (01_walkthrough.ipynb)
reports/        tables/ (CSV), figures/ (PNG), findings.json
scripts/        Windows scheduled-task registration (-WhatIf supported)
docs/           data dictionary